

4 mins read
|
07-30-2026
How to Enable DebugView in GA4 for your Magento 2 store
Vinh Jacker
|
06-09-2026

You’ve installed GTM, connected GA4, and events seem to be firing. But are you actually sure the data is correct?
Most Magento merchants skip this step, and end up making decisions based on broken tracking. Missing transaction_id, wrong revenue numbers, purchase events that never reach GA4. It all looks fine on the surface until you dig in.
GA4 DebugView is how you verify your entire tracking setup before trusting a single number in your reports. This guide walks you through exactly how to enable it and what to check for a Magento 2 store.
What Is GA4 DebugView?
GA4 DebugView is a real-time event stream inside your GA4 Admin panel. It shows every event your store sends to Google Analytics as it happens, with full parameter details.
But isn’t GTM Preview enough?
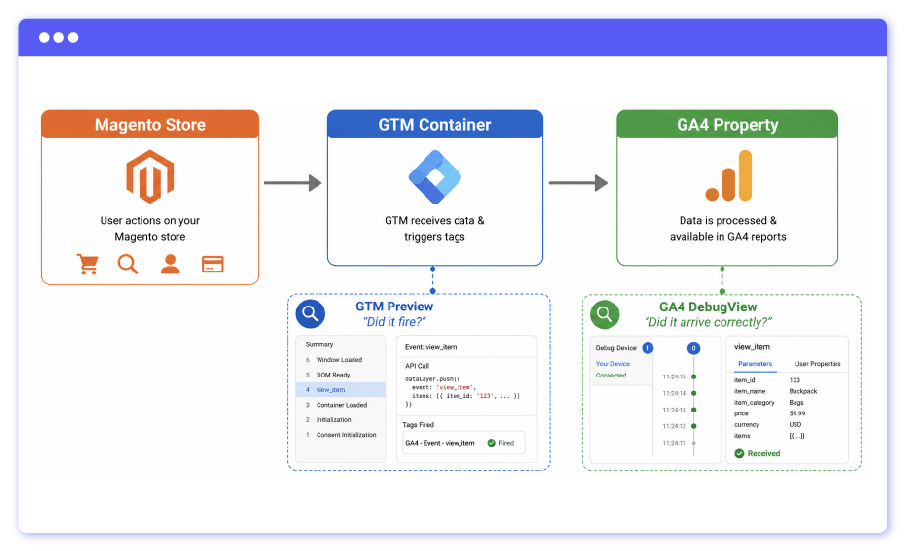
Not quite. The two tools do different things:
- GTM Preview tells you whether a tag fired inside your GTM container
- GA4 DebugView tells you whether that data actually reached GA4 — and whether it arrived correctly
Imagine that GTM Preview is the shipping confirmation, which tells you the package left the warehouse; while GA4 DebugView is the delivery confirmation, which tells you the package actually arrived, and nothing was missing inside.
This matters more for Magento 2 than most platforms. A typical Magento store pushes complex eCommerce events — view_item_list, add_to_cart, begin_checkout, purchase — each with nested parameters like items[], transaction_id, and revenue. One misconfigured data layer push and your reports silently show wrong numbers.
DebugView is how you catch that before it becomes a data quality problem.
Haven’t got GA4 on Magento? Start here first: How to Add Google Analytics 4 to Magento 2
Three Ways to Enable GA4 DebugView
Method 1: Via GTM Preview Mode (Recommended)
This is the easiest approach with no extra tools needed, and you can debug GTM and GA4 at the same time.
- Go to your GTM workspace and click Preview
- Enter your Magento store URL → click Connect. A new tab opens with a
?gtm_debug=parameter in the URL - Go to GA4 → Admin → DebugView — events will start appearing automatically as you browse your store
Best for: verifying your full tracking stack in one session
Method 2: Google Analytics Debugger Chrome Extension
A quick option when you want to check DebugView without going through GTM Preview.
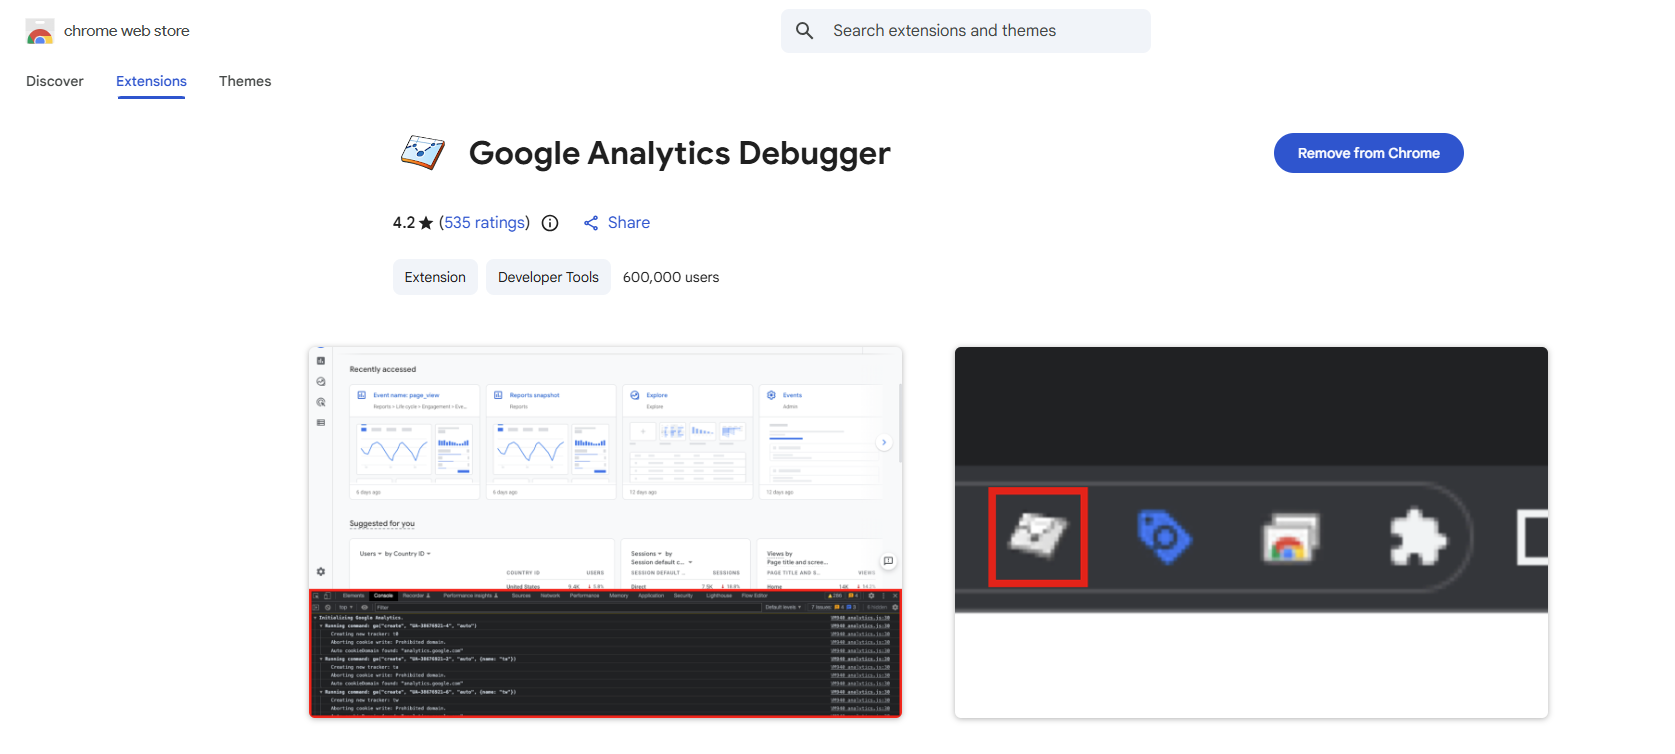
- Install the Google Analytics Debugger extension from the Chrome Web Store
- Enable the extension → reload your Magento store
- Open GA4 → Admin → DebugView and browse your store to trigger events
Best for: quick spot checks on a live store
Method 3: Add debug_mode Parameter to Your GA4 Tag
Use this when GTM Preview isn’t an option; for example, when debugging on a remote environment.
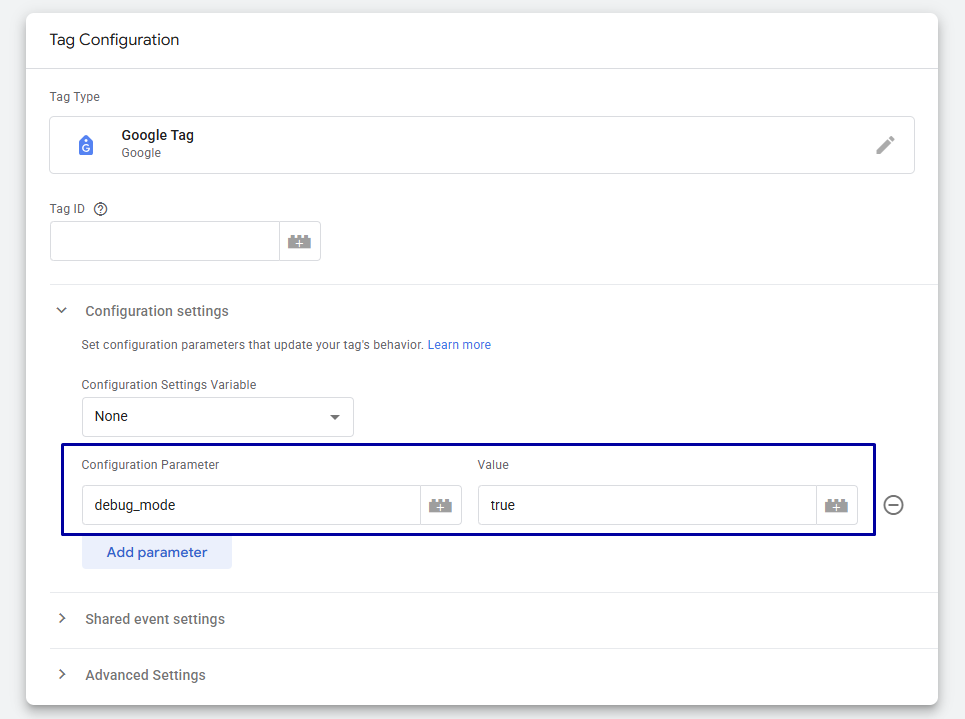
- In GTM, open your GA4 Configuration Tag
- Under Additional Parameters, add:
debug_mode = true - Submit and Publish the container
⚠️ Important: This method activates DebugView for all visitors, not just you. Remove the parameter and republish before going back to production.
How to Verify Key Magento 2 eCommerce Events in DebugView
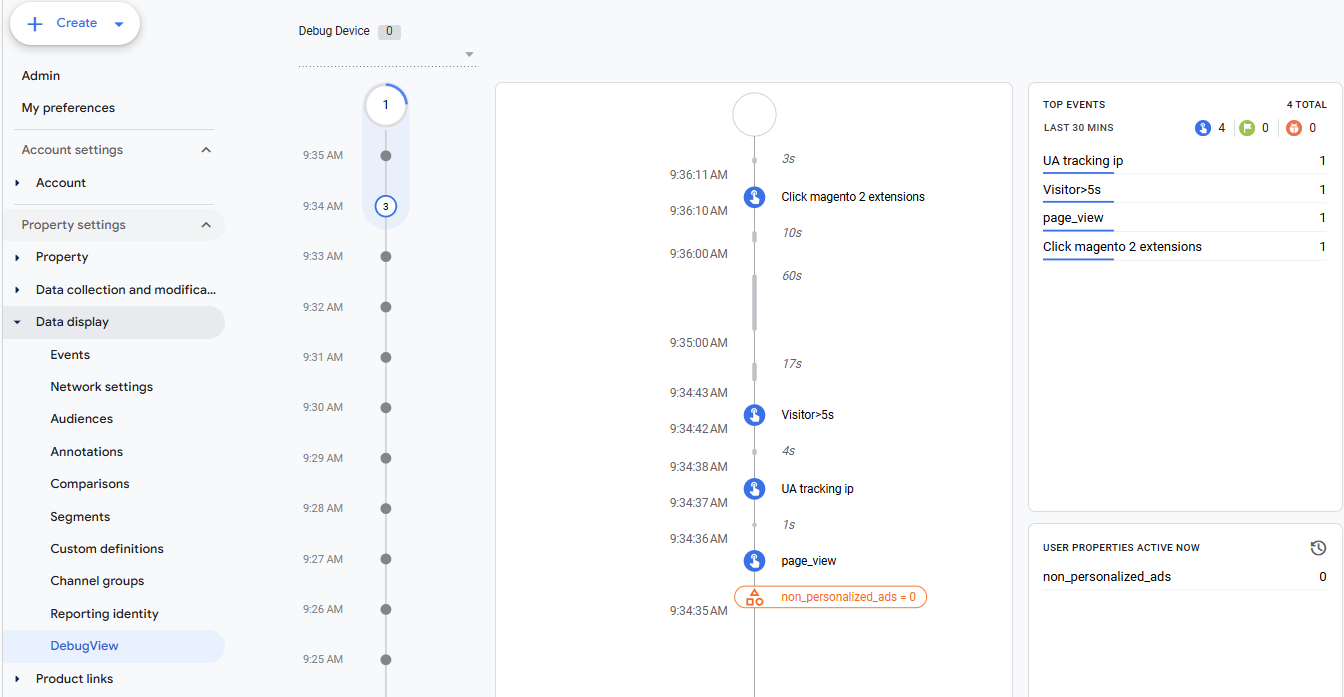
Once you’re in GA4 → Admin → DebugView, you’ll see three areas:
- Minutes Stream — a 30-minute overview showing how many events fired each minute
- Seconds Stream — a detailed timeline; click any event to expand its parameters
- Top Events — the most frequently fired events in the last 30 minutes
Use the Seconds Stream to verify each event below. Click the event name → expand the parameter list → check that every key field has the right value.
| Event | Fires when | Parameters to verify |
|---|---|---|
| page_view | Any page loads | page_title, page_location |
| view_item_list | Category or search page | item_list_name, items[] |
| view_item | Product detail page | item_id, item_name, price |
| add_to_cart | Add to Cart is clicked | currency, value, items[] |
| begin_checkout | Checkout page step 1 | value, items[] |
| purchase | Order success page | transaction_id, revenue, tax |
Watch out for these red flags:
transaction_idisnullormissingon purchase → your Order Success page data layer is brokenvalue = 0onadd_to_cartorpurchase→ price is not being passed correctly- An event doesn’t appear at all → check your GTM trigger, or flush your Magento cache and test again
Once your events are verified and clean, the next step is putting that data to work:
- GA4 Ecommerce Reports for Magento Merchants: How to read and act on what GA4 collected
- Google Analytics Website Traffic: A–Z Guide: Understanding traffic sources alongside your event data
Common Issues Found in DebugView (and How to Fix Them)
If something looks off in DebugView, it’s almost always one of these:
- DebugView is completely empty: Your GTM container may not be published, or the Measurement ID in your GA4 Configuration Tag doesn’t match your GA4 property. Double-check both before anything else.
purchasefires buttransaction_idis missing: The data layer on your Order Success page isn’t pushing the right values. Check that your purchase event is firing after the order data is available in the page — timing matters here.add_to_cartdoesn’t fire: Usually a trigger issue in GTM. Magento uses AJAX for add-to-cart actions, so a standard click trigger often misses it. You’ll need a custom event trigger that listens to the data layer push instead.- Events appear multiple times: Your GA4 tag is firing more than once per event. Review the tag’s firing conditions in GTM and make sure no duplicate triggers are set up.
- Changes not showing up in DebugView: Flush your Magento cache. This is the most common reason updates don’t reflect — especially after editing GTM config or extension settings in the admin panel.
For a deeper look at GTM-specific issues on Magento, see: GTM Debugging on Magento: Complete Troubleshooting Guide
Best Practices: Using DebugView Responsibly
DebugView is a diagnostic tool, so it’s meant to be used temporarily, not left running in the background. Two rules to keep in mind:
- Always remove
debug_mode: truebefore publishing to production. This parameter activates DebugView for every visitor on your site. Leave it on and your DebugView fills with real traffic, making it impossible to isolate your own test sessions. - Re-run DebugView after every update. A Magento extension update, a GTM container change, or a theme tweak can silently break your tracking pipeline. Make DebugView part of your deployment checklist, not just your initial setup.
Tracking breaks quietly. By the time you notice something is wrong in your GA4 reports, you may have already lost days or weeks of clean data. A quick DebugView check after every update costs you five minutes and saves a lot of cleanup work later.
FAQs
Does GA4 DebugView work without GTM?
Yes. You can enable it using the Google Analytics Debugger Chrome Extension, or by adding debug_mode: true directly to your GA4 Configuration Tag. GTM Preview is the most convenient method, but it’s not the only one.
How long does it take for events to appear in DebugView?
Almost real-time. Most events show up within a few seconds, though you may occasionally see a 5–10 second delay.
Can I use DebugView on a Magento 2 staging site?
Yes. DebugView works on any environment (local, staging, or production) as long as your GTM container is installed and your GA4 tag is configured correctly.
Will enabling debug_mode affect my GA4 reports?
No. Events sent in debug mode are excluded from your standard GA4 reports and only appear in DebugView. Your production data stays clean.
Conclusion
Complex eCommerce events, AJAX interactions, and multi-step checkout flows all create more room for tracking errors. A clean DebugView session is your confirmation that what GA4 shows matches what’s actually happening in your store.
If you haven’t set up GA4 and GTM for your Magento 2 store yet, Mageplaza Magento 2 Google Tag Manager Extension is the fastest way to get there, with pre-built events, ready to verify on DebugView from day one.
Not sure how it stacks up against other options? See: How Mageplaza GTM Compares to Other Providers
Table of content

Jacker is the Chief Technology Officer (CTO) at Mageplaza, bringing over 10 years of experience in Magento, Shopify, and other eCommerce platforms. With deep technical expertise, he has led numerous successful projects, optimizing and scaling online stores for global brands. Beyond his work in eCommerce development, he is passionate about running and swimming.
Related Post

7 mins read
|
06-30-2026
How to Enable DebugView in GA4 for your Magento 2 store - Mageplaza
Step-by-step guide to enabling GA4 DebugView for Magento 2 merchants — verify your GA4 events are firing correctly before trusting your data.
9 mins read
|
06-09-2026
Table Rate Shipping in eCommerce: A Practical Guide
Master Magento 2 Table Rate Shipping. Learn how to configure an accurate, automated shipping matrix to optimize your checkout and boost sales.
11 mins read
|
06-02-2026
3 mins read
|
05-30-2026
Google Analytics Ecommerce Reports for Magento Merchants: What to track & Tips
A practical guide to GA4 ecommerce reports for Magento merchants, covering what to track, how to read each report, and specific tips to turn data into revenue decisions.
19 mins read
|
05-20-2026
4 mins read
|
07-30-2026
7 mins read
|
06-30-2026
How to Enable DebugView in GA4 for your Magento 2 store - Mageplaza
Step-by-step guide to enabling GA4 DebugView for Magento 2 merchants — verify your GA4 events are firing correctly before trusting your data.
9 mins read
|
06-09-2026
Table Rate Shipping in eCommerce: A Practical Guide
Master Magento 2 Table Rate Shipping. Learn how to configure an accurate, automated shipping matrix to optimize your checkout and boost sales.
11 mins read
|
06-02-2026
3 mins read
|
05-30-2026
Google Analytics Ecommerce Reports for Magento Merchants: What to track & Tips
A practical guide to GA4 ecommerce reports for Magento merchants, covering what to track, how to read each report, and specific tips to turn data into revenue decisions.
19 mins read
|
05-20-2026