

6 mins read
|
06-30-2026
How to Install Xdebug PHP and Setup PHPStorm via CLI without Apache
Vinh Jacker
|
03-17-2025

Open the

When developing PHP applications, debugging is essential for identifying and fixing issues. Xdebug will be a useful tool that helps you to debug your PHP code effectively.
In this article, we’ll explore how to install Xdebug and set up PHPStorm via CLI without Apache. Let’s dive in now!
Step 1: PHP and Xdebug installation
- The first step is to confirm whether PHP has already been installed on your system. If it’s not, you’ll need to install it, which varies depending on your operating system. For instance, Ubuntu users can run this code:
sudo apt update
sudo apt install php8.3
- The next step is to install the Xdebug extension compatible with your PHP version. Here is how:
sudo apt-get install php{php_version}-xdebugEx: sudo apt-get install php8.3-xdebug
- Verify the Xdebug installation by running:
php -v
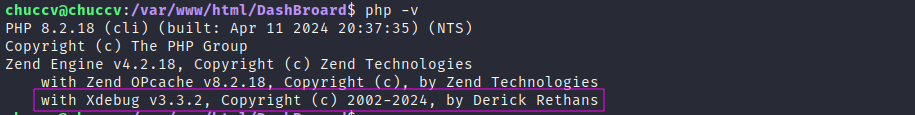
- Xdebug is shown in that version.
Step 2: Xdebug in xdebug.ini configuration
Open the xdebug.ini file for editing
- Choose one of these commands to open the
xdebugfile.sudo gedit /etc/php/8.3/mods-available/xdebug.ini or sudo nano /etc/php/8.3/mods-available/xdebug.iniCopy and paste the content to a specific file
- For Xdebug 2, you need to add the following configuration:
[Xdebug] zend_extension="xdebug.so" xdebug.mode=debug,develop xdebug.start_with_request=default xdebug.idekey=PHPSTORM xdebug.client_port=9000 #run on port 9000 xdebug.file_link_format=phpstorm://open?%f:%l - Insert the following configuration for Xdebug 3:
#zend_extension=/usr/lib/php/20151012/xdebug.so xdebug.remote_autostart = 1 xdebug.remote_enable = 1 xdebug.remote_handler = dbgp xdebug.remote_host = 127.0.0.1 xdebug.remote_log = /tmp/xdebug_remote.log xdebug.remote_mode = req xdebug.remote_port = 9000 #run on port 9000 -
Save the file.
- Then, restart Apache with this content:
sudo service apache2 restart
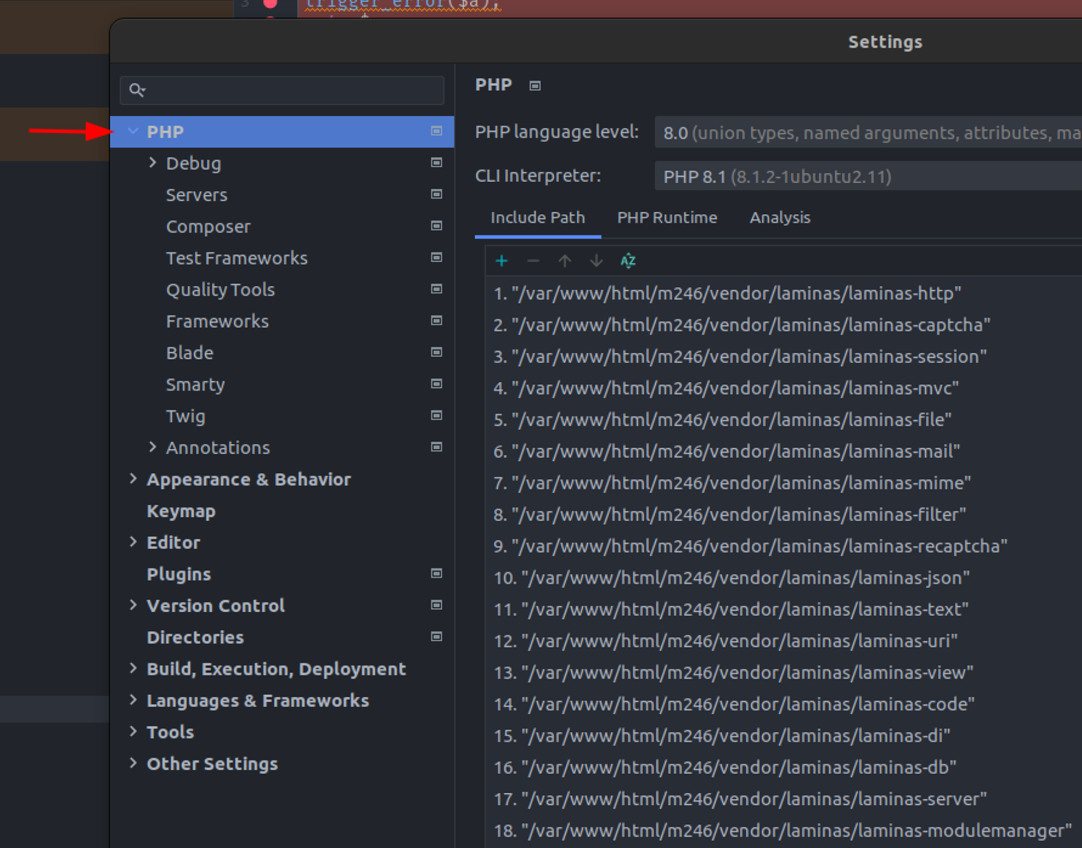
Step 3: PhpStorm configuration
-
Open
PhpStormand navigate toSettings -
Click on
PHP.
- Go to the
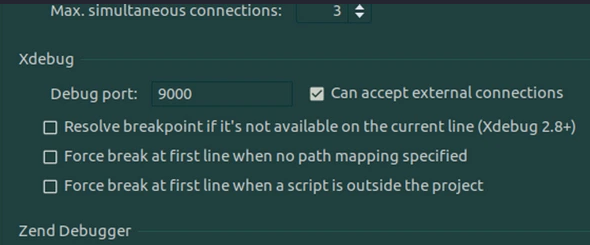
Debugsection and set theXdebug portto 9000 (as specified in xdebug.ini).
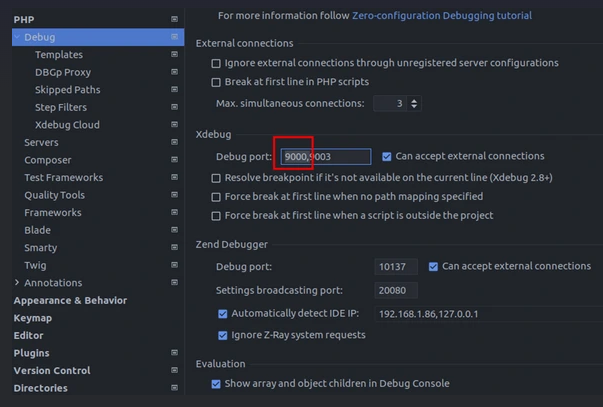
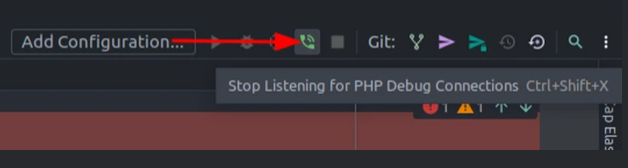
- Click the call icon to turn on listening at the configured port.
Step 4: Xdebug testing
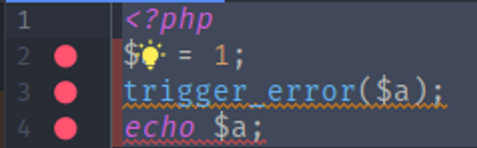
Create any php file
For example test.php. Be careful with name files.
<?php
$a = 1;
trigger_error($a);
echo $a;
Set Breakpoint
Run the newly created php file when there is XDEBUG_SESSION_START=”PHPSTORM”, the PHP server will receive this variable and send data through the configured port:
XDEBUG_SESSION_START="PHPSTORM" php test.php
Other way to use with Magento CLI
XDEBUG_SESSION_START="PHPSTORM" php bin/magento se:up
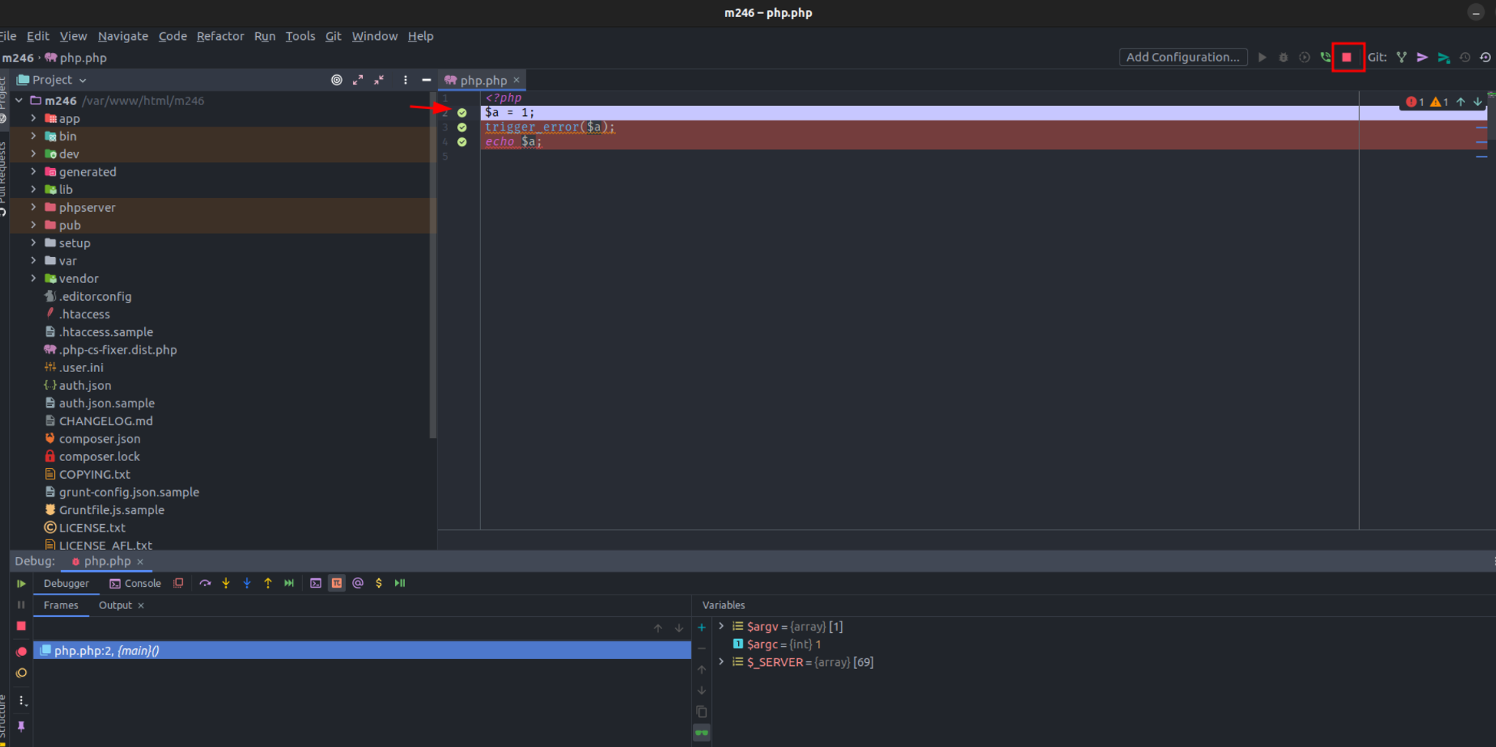
The result is right when the screen appears the content below:
Note: Possible Error Encountered
If Xdebug doesn’t run, use the command to check it first because the error will have a Message to check.
Xdebug: [Step Debug] Could not connect to debugging client. Tried: localhost:9000 (through xdebug.client_host/xdebug.client_port).
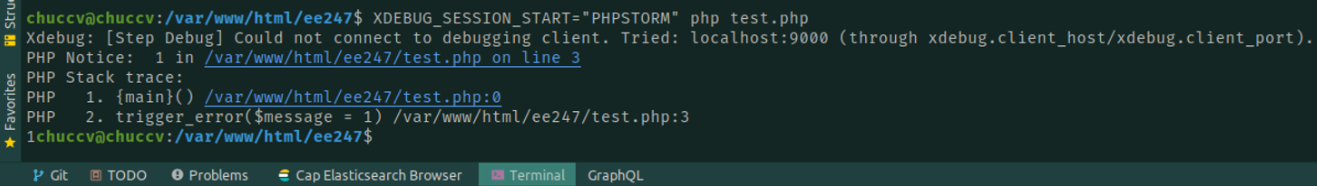
Looking at the message above, the issue lies in debugging the client, which is related to PHPStorm. The IDE is not responding to PHP at this time.
How to fix this issue:
-
Check PHPStorm Options: Explore the options in PHPStorm related to debugging such as resolve breakpoint if it is not available on the current line (Xdebug 2.8+), force break at first line when no path mapping specified, and force break at first line when a script is outside the project and try to turn on these options.
-
Restart PHPStorm: After making any changes, restart PHPStorm to see if the issue is resolved.
In conclusion
By following these detailed 4 steps, you can install Xdebug and set up PHPStorm for CLI debugging without relying on Apache. Enjoy effective PHP debugging directly from the command line.
If you have any questions while following this tutorial, feel free to ask!
Table of content

Jacker is the Chief Technology Officer (CTO) at Mageplaza, bringing over 10 years of experience in Magento, Shopify, and other eCommerce platforms. With deep technical expertise, he has led numerous successful projects, optimizing and scaling online stores for global brands. Beyond his work in eCommerce development, he is passionate about running and swimming.
Related Post

How to Enable DebugView in GA4 for your Magento 2 store - Mageplaza
Step-by-step guide to enabling GA4 DebugView for Magento 2 merchants — verify your GA4 events are firing correctly before trusting your data.
8 mins read
|
06-09-2026
Table Rate Shipping in eCommerce: A Practical Guide
Master Magento 2 Table Rate Shipping. Learn how to configure an accurate, automated shipping matrix to optimize your checkout and boost sales.
10 mins read
|
06-02-2026
3 mins read
|
05-30-2026
Google Analytics Ecommerce Reports for Magento Merchants: What to track & Tips
A practical guide to GA4 ecommerce reports for Magento merchants, covering what to track, how to read each report, and specific tips to turn data into revenue decisions.
18 mins read
|
05-20-2026

5 Ways to Hide Products on Shopify (2026 Guide)
Explore the best 5 ways to hide products on Shopify. Learn how to manage visibility, protect pricing, and create a tailored shopping experience for buyers.
18 mins read
|
05-16-2026
6 mins read
|
06-30-2026
How to Enable DebugView in GA4 for your Magento 2 store - Mageplaza
Step-by-step guide to enabling GA4 DebugView for Magento 2 merchants — verify your GA4 events are firing correctly before trusting your data.
8 mins read
|
06-09-2026
Table Rate Shipping in eCommerce: A Practical Guide
Master Magento 2 Table Rate Shipping. Learn how to configure an accurate, automated shipping matrix to optimize your checkout and boost sales.
10 mins read
|
06-02-2026
3 mins read
|
05-30-2026
Google Analytics Ecommerce Reports for Magento Merchants: What to track & Tips
A practical guide to GA4 ecommerce reports for Magento merchants, covering what to track, how to read each report, and specific tips to turn data into revenue decisions.
18 mins read
|
05-20-2026
5 Ways to Hide Products on Shopify (2026 Guide)
Explore the best 5 ways to hide products on Shopify. Learn how to manage visibility, protect pricing, and create a tailored shopping experience for buyers.
18 mins read
|
05-16-2026